Category Archives: FX

G10 FX Position Report Update

G10 FX POSITIONING REPORT

Wed Nov 04 23:35:52 2015

The following report aims to provide a gauge to the current market positioning in G10 FX. It focuses on US$ crosses and uses a standardised statistical measures of price deviation as well as a regression methodology to produce an estimate of how stretched currency exchange rates are and also to evaluate how currency managers are likely to be positioned and leveraged in G10 Currency. I use the BTOPFX in the report but can do the computations for any other peer group benchmark.

G10 FX STRETCH MAP

The stretch indicator looks at how much exchange rates are extended by calculating the T-stat of the mean price deviation over a rolling period of 61 days. The charts below shows the results for each currency pairs over the last 500 days. The spot prices are expressed as 1 unit of foreign currency versus the USD. The purple line represent the median value since 2005 and the red lines represent the 95% confidence intervals. Therefore if the value is above or below those the deviation of the given exchange rate would be deemed as atypical relative to what would be expected under a normal distribution and therefore overbought/oversold.

plot of chunk stretch line chart

The below shows the above calculated T-stats but this time relative to their historical distributions. Once again the red lines delimit the 95% confidence intervals and the purple line the median value. The blue line indicates the most current value of the T-stat.

plot of chunk stretch distribution

The following Map chart shows how stretched G10 FX exchange rates are over time horizons ranging from 1-month to 6-month. The bigger the square the most significant the upside (green) or downside (red) of the exchange rate over the given period. All the exchange rates are quoted on CCY-US$ basis so red indicate a depreciation of a given CCY against US$ and green an appreciation versus the US$.

plot of chunk stretch map

Estimated Currency Managers Positioning in G10 FX

To determine the sensitivity of currency managers to exchange rates and therefore their current positioning we regress the daily returns of the BTOPFX index against the daily logarithmic returns of G10 FX rates. We then calculate the T-stat for each of the regression’s slope coefficients. The higher the T-stat the higher the sensitivity to a given currency and therefore likely positioning. Using the regression weights as well as the variance of the independent and explanatory variables as input we can then easily deduce an estimation of the current risk utilisation of the typical currency manager as inferred by the values of the BTOPFX.

The below shows the T-stat of the regression’s slope coefficients over the last 500 days. The purple line represents the median value since 2005 and the red lines represent the 95% confidence intervals. Therefore if the value is above or below the red lines the positioning in a currency would be deemed as extreme and therefore the risk of unwinding would be greater since the market inventory would likely be close to its highest. Probably highlighting a good environment to enter a contrarian trade.

plot of chunk sensitivity line chart

The sensitivity of currency managers returns to changes in G10 FX rates relative to their historical distribution is shown below. Once again the red lines are the 95% confidence intervals and the purple line the median value. The blue line indicates the most current value of the T-stat. If this one is either side of the intervals of confidence it indicates a potentially overextended market positioning in the given currency.

plot of chunk sensitivity distribution

The exposure to the US$ is derived from the combined sensitivities to the other currencies and is shown in the same fashion than for the other currencies. Namely against an axis of time and relative to its historical distribution.

plot of chunk USD sensitivity

The below Map chart shows the currency managers sensitivity to G10 FX exchange rates over time horizons ranging from 1-month to 6-month. The bigger the square the most significant the sensitivity to a currency the exchange rate over the given period. Long positioning is shown in green and short in red.

plot of chunk sensitivity map

Estimated Leverage

As explained previously the level of risk utilisation of currency managers and therefore their gearing can easily be derived by using the regression coefficients and the variances of both the independent and explanatory variables. The chart below shows the rolling estimation of risk utilisation as well putting it in respect of its historical distribution. Average Risk utilisation over the last 61 days is estimated at 31.36 % of maximum.

plot of chunk leverage

Trade Weighted Currency Indices Stretch Map

Trade Weighted Currency Indices Report

Wed Nov 04 23:43:36 2015

The following report aims to provide a gauge to the current strenght of major currencies. For doing so I use the Bank of England Trade weighted Exchange rate indices and a standardised statistical measures of price deviation to provide an estimate of how stretched major currencies are on a trade weighted perspective.

plot of chunk linechart

I first calculate the T-stat of the mean price deviations over a rolling period of 61 days. The charts below show the results for each currency over the last 500 days. The purple line represents the median value since 1990-01-03 and the red lines represent the 95% confidence intervals. Therefore if the value is above or below those the deviation of the given currency would be deemed as atypical relative to what would be expected under a normal distribution and therefore overbought/oversold.

plot of chunk rolling chart

The following Map chart shows how stretched the currencies are over time horizons ranging from 1-month to 1-year. The bigger the square the most significant the upside (green) or downside (red) of currencies over the given period.

plot of chunk stretch map
The charts below show how the daily changes in the Trade weighted indices have correlated since January 1990 and since the begining of 2015.

plot of chunk correlation
Finally, the following provide an ARIMA forecast for each of the trade weighted indices. My script selects the best ARIMA fit over the previous 250-day to generate a forecast for the next 21 days.
It also shows the forecast confidence intervals.

plot of chunk arimaforecastplot of chunk arimaforecastplot of chunk arimaforecast

USD TWI Update….

Whatever the market being traded, there always will be a a question being asked at one moment: How far can this thing go ? Clearly not an easy question to answer as this will invariably depends on factors that are partly unknown or difficult to estimate, such as fundamentals, market positioning or market risk amongst others. The first part is obviously to assess how atypical the move experienced in the given instrument is. This report aims to contribute to this.

The below chart shows the USD TWI over the period of January 1990 to August 2015 . On the 19 August 2015 it was trading around 104.5947.

plot of chunk chartdata

In the below I plot the previous 125 days against other similar historical periods that would have closely matched the recent history. The data has been normalised so as to be on the same scale. The chart shows the latest 125 days in black, and overlay similar historical patterns in grey. It Also shows what has been the price path for the following 125 days as well as the observed quartiles.

plot of chunk pattern

Finally I plot the last 125 days and a trend forecast derived from an ARIMA(3,1,2) model as well as the 95% confidence intervals. The ARIMA model is fitted to the past 625 historical values whilst ignoring the last 125 days, therefore we can look at the recent price path against the trend forecast and its confidence intervals to gauge how (a)typical the recent move has been.

plot of chunk arimaplot

G10 FX Position Report 16-02-2015

G10 FX POSITIONING REPORT

Mon Feb 16 10:58:42 2015

The following report aims to provide a gauge to the current market positioning in G10 FX. It focuses on US$ crosses and uses a standardised statistical measures of price deviation as well as a regression methodology to produce an estimate of how stretched currency exchange rates are and also to evaluate how currency managers are likely to be positioned and leveraged in G10 Currency. I use the BTOPFX in the report but can do the computations for any other peer group benchmark.

G10 FX STRETCH MAP

The stretch indicator looks at how much exchange rates are extended by calculating the T-stat of the mean price deviation over a rolling period of 61 days. The charts below shows the results for each currency pairs over the last 500 days. The spot prices are expressed as 1 unit of foreign currency versus the USD. The purple line represent the median value since 2005 and the red lines represent the 95% confidence intervals. Therefore if the value is above or below those the deviation of the given exchange rate would be deemed as atypical relative to what would be expected under a normal distribution and therefore overbought/oversold.

plot of chunk stretch line chart

The below shows the above calculated T-stats but this time relative to their historical distributions. Once again the red lines delimit the 95% confidence intervals and the purple line the median value. The blue line indicates the most current value of the T-stat.

plot of chunk stretch distribution

The following Map chart shows how strethed G10 FX exchange rates are over time horizons ranging from 1-month to 6-month. The bigger the square the most significant the upside (green) or downside (red) of the exchange rate over the given period. All the exchange rates are quoted on CCY-US$ basis so red indicate a depreciation of a given CCY against US$ and green an appreciation versus the US$.

plot of chunk stretch map

Estimated Currency Managers Postioning in G10 FX

To determine the sensitivity of currency managers to exchange rates and therefore their current positioning we regress the daily returns of the BTOPFX index against the daily logarithmic returns of G10 FX rates. We then calculate the T-stat for each of the regression’s slope coefficients. The higher the T-stat the higher the sensitivity to a given currency and therefore likely positioning. Using the regression weights as well as the variance of the independent and explanatory variables as input we can then easily deduce an estimation of the current risk utilisation of the typical currency manager as inferred by the values of the BTOPFX.

The below shows the T-stat of the regression’s slope coefficients over the last 500 days. The purple line represents the median value since 2005 and the red lines represent the 95% confidence intervals. Therefore if the value is above or below the red lines the positioning in a currency would be deemed as extreme and therefore the risk of unwinding would be greater since the market inventory would likely be close to its highest. Probably highlighting a good environment to enter a contrarian trade.

plot of chunk sensitivity line chart

The sensitivity of currency managers returns to changes in G10 FX rates relative to their historical distribution is shown below. Once again the red lines are the 95% confidence intervals and the purple line the median value. The blue line indicates the most current value of the T-stat. If this one is either side of the intervals of confidence it indicates a potentially overextended market positioning in the given currency.

plot of chunk sensitivity distribution

The exposition to the US$ is derived from the combined sensitivities to the other currencies and is shown in the same fashion than for the other currencies. Namely against an axis of time and relative to its historical distribution.

plot of chunk USD sensitivity

The below Map chart shows the currency managers sensitivity to G10 FX exchange rates over time horizons ranging from 1-month to 6-month. The bigger the square the most significant the sensitivity to a currency the exchange rate over the given period. Long positioning is shown in green and short in red.

plot of chunk sensitivity map

Estimated Leverage

As explained previously the level of risk utilisation of currency managers and therefore their gearing can easily be derived by using the regression coefficients and the variances of both the independent and explanatory variables. The chart below shows the rolling estimation of risk utilisation as well putting it in respect of its historical distribution. Average Risk utilisation over the last 61 days is estimated at 25.36 % of maximum.

plot of chunk leverage

Is The Fed Changing Its View About Inflation ?

Yesterday in her  Semi-annual Monetary Policy Report to the Congress,  Chairman  Janet Yellen  stated the following: “If the labor market continues to improve more quickly than anticipated by the Committee… then increases in the federal funds rate target likely would occur sooner and be more rapid than currently envisioned.”  However Treasury yields  have barely moved and the dollar appreciation  again the Greenback remained muted . The Euro depreciated only by 0.6% against the US Dollar since her speech.  As shown from the chart below though the dollar against a broad basket of currencies is fairly well priced this is not the case for 10-year yields. US 10 year yierld traded weighted Against all odds, Yellen  seems to have managed to contain market expectations yet again. This is quite outstanding when one looks at the hard data. Unemployment is clearly below the 6.5%  Fed target level. Also the rise in industrial production is quite telling of  an even lower unemployment rate in the months to come. unemployement USINDPRO

It is true that we have not yet seen much wage inflation in the us. The annual rate of increase in the average hourly earnings remains below 2% as shown below.  Wages remain dampened by the spare labour capacity. average earnings Clearly the Fed has accepted to remain behind the curve for quite a while  so  as not  to compromise any renewed  growth  in the US. The current low level of the Fed fund rate is a good illustration of  this. Fed Fund Contributing to a generally  dim view on the US economy by Fed members  could be that many forecasting models use 2×10 spreads as an input to forecast GDP. The abnormally ultra-low fed fund and therefore current steepness of the curve  could contribute to why  the Fed  growth forecasts may not be as accurate as should be.  After all even the IMF got it wrong with its growth forecast for the UK. 2x10It is now noticeable that over the last few months,  Inflation has crept  above the 2% target of the fed as indicated by the below chart. This is not surprising as trend in consumerism and aptitude of  price increase  is somehow function of  employments and wages earned. Though arguably not yet at an alarming level it will be interesting to watch out how the Fed react to further developments. US CPI So is the Fed starting to worry about inflation ? Plotting a Word Cloud of Yellen’s  speech it is indeed quite clear that Inflation is the central issue …..   yellen speechBearing in mind the above  it will be interesting to watch out for changes in the pattern of the inflows/outflows in US mutual funds. My thought is that we could see a resuming of the exit of bond products which was compromised by the ultra dovish tone adopted by Yellen when she took office. As mentioned in my previous post , the relative inflow/outflow in US versus foreign equities  could also have a perverse effect on the valuation of the US Dollar. High rates are not necessarily a long term driver of currency , capital flows are more important.  As a remainder of the current trends in US mutual funds  below are  couple of charts of my previous post. They show the distribution of the inflows/outflows in US mutual funds by asset class since the beginning of the year and the cumulative   flows in domestic versus foreign equities products since 2007. distribution inflows 2014cumulative flows I’ ll stick to my Long global equities and short dollar view…..

US Mutual Funds Flows Update: Investors Still Favouring International Equities

As it has been a while  since I have posted something and my broken arm is no longer a valid  excuse , I thought I would provide an update on  trends  in US mutual funds flows. To my surprise, bearing in mind the current geopolitical risks,  there has not been much change over the last few weeks. US investors have held onto  their preference for international equities whilst staying shy from the US stock markets. Also the trend of inflow into bonds   remained despite growing expectation of the Fed becoming more hawkish down the line. The map below shows the T-stats of the inflow/outflows across different time periods.

FLOWMAP

Clearly the dovish tone adopted by the Fed  has helped both the trend in equities and also bonds.  The question is how long  can this last ? Clearly the strengthening  observed in the US job market demonstrates that significant growth has rooted. Down the line this will create an issue for the fed, as managing rate expectations  whilst turning away from a dovish stance may prove challenging.  To me the most interesting point of all  is how US investors voted with their money. As can bee seen from the below charts they have stayed well away from US equities whilst investing in Foreign equities. In fact out of the US$ 133 bn invested in US mutual funds  44 %  (US$ 59 bn) went into  foreign equities  so far this year, whilst  US$ 5bn came out from US Stocks funds.

cumulative flows  distribution inflows 2014

As said in my previous posts I believe that what we are seeing could be a good explanatory variable as of  why the dollar has been so weak and particularly against the EURO despite the monetary expectation in Europe and the US. Bearing in mind the current market positioning and central bank flows it may well be that the  EURUSD is currently undervalued….


FX: The End of the World as we knew It ?

I recently went to Imperial College to give a lecture  on currency management issues and decided to  post a  quick summary of it here. If you want more detailed information , feel free to contact me. The first chart shows the evolution of the FX turnover as reported by the BIS in its triennial FX survey. Clearly we have seen a significant increase in FX volume being transacted. From a paltry estimated daily  turnover of 650 billions  market participants are now dealing close to 5 trillions dollar a day.Picture1

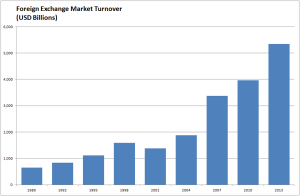
The rise in the percentage of foreign assets  held in both institutional and private portfolios has been supported by both by the increase in the degree of openness of major world economies and the quest for greater portfolio diversification .  Therefore currencies have been called to play a greater role as they became the necessary conduct to foreign assets. Subsequently  active managers  have developed their currency forecasting skills and incorporated directional forecasts in their  asset allocation decisions. This somehow brought a new breed of managers that focussed solely on currencies, be it for speculative (currency as an asset class) or hedging reasons (currency overlay). Indeed a more specialised knowledge is  arguably required  due to the specificity of currency markets. The success  and growth in numbers of those managers is well illustrated by the below charts that shows the rolling  3-year risk adjusted return of the median currency managers and the number of currency programs tracked by the investment consultant Mercer.

Picture12Picture11

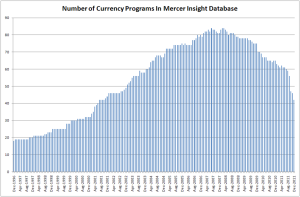
Despite a promising start  both in absolute and relative terms it is fair to say that the typical currency manager performance has somehow degraded over the last decade. The number of pure currency  programs has been significantly reduced since 2008. Recently we have seen the closure of funds managed by FX concepts, QFS and Brevan Howard amongst other casualties.  The recent history of risk and the particular chain of events that took place following the onset of the Sub-Prime Mortgage crisis has a strong explanatory power  to this  as it triggered the change of market regime  which affected negatively the performance of many active managers out there be them currency or else. The following chart shows the ratio between the volatility of the VIX and its nominal level over a rolling period of 21 days, which historically has been a good classifier of risk events. Clearly risk spikes have been more frequent and it may well be that active managers as a whole found it more difficult to operate within this new regime. Maybe some strategies were too “naive” or clearly lacking in portfolio construction and robust risk management.

Picture10

Possible explanation to lesser returns  may lie in central banks driving their monetary policy in unchartered territory  in an attempt to deal with the financial crisis. This resulted in short term interest rates reaching absurdly low levels globally. This somehow eroded the incentive  the carry strategy which had been a significant source of returns for currency managers.

Picture4Picture3

Looking at a large sample of data  spanning from the early 70′ to date it is noticeable that  the short term carry that can be obtained through buying currencies with a high level of interest and selling the ones with low nominal interest rate has steadily decreased from what used to be to currently reach an all time low.  The above charts show that the median level of carry spread for G10 crosses  (1-month nominal rate differentials) has decreased from 4.10% to 2.32% whilst the average level of delivered volatility for the 45 exchange rates in focus has increased from a median 10.63% over the first period to 11.44 % for the second period. In other word the average delivered risk return of G10 carry strategies has nearly halved from   0.39 to 0.21 prior albeit modest transaction costs. At current level of carry of close to 1% the risk return of carry stands at close to 0.1 which is clearly not very attractive from an investor standpoint of view. However damaging the reduction in spreads and change in market risk regimes  may have been to the performance of managers it is fair to argue that those may be just transitory  in nature  and that better days will come for currency managers when central banks will step back from their extraordinary measures.

More concerning to investors  may be some structural issues that have remained unnoticed  or ignored by many managers. The last 25 years has been dominated by significant progresses in telecommunication and computing technology. Those innovations have had  without any doubts a massive impact on how market practitioners transact in the markets. Technology developments clearly affected trader’s ability to access the market in terms of speed , efficiency and information gathering. It is symptomatic indeed that over the last couple of decades voice broking virtually disappeared whilst electronic trading platforms came to dominate the trading landscape. I surmise that a significantly enhanced transparency, price discovery and  sharply increased  speed of transaction may have put us a step closer to a strong form of market efficiency  as described by Fama (1970).

Picture5        Picture6

Currency can be classified under different regimes (trending, mean reverting or random) by using the autocorrelation and drift significance of the underlying time price series. The below figure shows the aggregated  level of membership to each regime and its local polynomial regression fit for the 45 G10 crosses since 1971. We used a rolling window of 125 days to do conduct the analysis ( contact me if you want to know about the methodology I used).

Picture2

The most dominant feature is the significant increase in exchange rate randomness which correlates with the decrease in performance of currency managers observed over the last decade. Clearly some managers have fared better than other due to their exposure to less liquid emerging market currencies therefore reaping higher return because of larger interest rate spreads, however as was seen during various crisis and in early 2014 this would have been by taking on board greater risk premium and therefore being of a disputable service to investors.

World globalisation and the growth in technological and transactional technology over the last few decades has reshaped the investor opportunity set as Lebaron (1999) partly concluded in his own research it also explains the disappearance of some inefficiencies.  The KOF Swiss Economic Institute , one of the leading economic “think tanks” in Switzerland  compiles the Index of Globalization. The index measures three main dimensions of globalization, namely: economic, social and political. There are also sub-indices referring to actual economic flows , economic restrictions , data on information flows , data on personal contact  and data on cultural proximity.  The data is available on a yearly basis for 207 countries. It is currently available for the period 1970 – 2010 . Clearly the KOF  Index of globalisation provides a tangible evidence of how much more integrated the world has become over the period 1970 to 2010 as shown in  the below figures. The darker the shade the more “globalised” a country is, clearly the world in 2010 has become a darker shade of grey and therefore is more “integrated” or “globalised”.

Picture7

Over the last 40 odd years huge technological progresses have been made. Communication and computing technology has equipped us with the ability to capture and analyse a  broader set of information at a near real time frequency. It is now possible to transfer assets across borders at the flick of a button and therefore to settle transaction over very short term periods. The  transactional technology and a greater openness of countries economies  has allowed for investor to have a faster response time to the information set at hand. The following shows  the  average index of globalization for 175 countries  as well as the sub-indices for actual economic flows (as a broad measure of economic openness) and data on information flows (as a measure of communication technology progress).

IPicture8

It  is apparent  from  the above that the trend in the level of randomness of currencies  has significantly increased  over the last 40 odd years and that this trend correlates positively to the globalisation trend, greater openness of world economies and development in communication technology. The predictability of currencies over that period has lessened  as would be consistent with higher information arrival and availability. Clearly the cheaper cost of  microchips and software  has brought us a step closer to the strong form of market efficiency.  Single style / naive currency strategies are therefore less likely to be of interest to investors as the premises they are based upon  have been seriously impaired by those developments. It is therefore likely that most systematic or discretionary investment processes relying on past tenets might encounter significant headwinds as we have seen. However the variability in exchange rate membership  to the random/trending and mean reverting  regime that I have observed in my research may offer some opportunities  to managers who invest time and resources  on regime detection technology. It is therefore my  belief that investors should give greater consideration to multifactor regime switching frameworks be them systematic or fundamentals  in order to derive significant returns from FX markets.


FX Moves

Ok we have had a few moves in FX over the last weeks and as liquidity is about to dry up I though it would make sense to look at how significant the moves in the main dollar crosses were…The chart below shows what were the T-Stats  for the G10 US$ exchange rates across different time period….

fxpositioning 3m  05122013 fxpositioning 05122013

Nothing looks out of what you would expect under the 95% confidence interval of a normal distribution…. so I guess I would stay with the trend… I.e long USD-JPY & EUR-USD and sell commodity currencies…..


What is the Fed Telling Us ?

Well yes it is FOMC time again and its seems to me that it is all dovish again and that definitively the Fed will stay behind the curve as long as is needed to have 100% certainty that when they hit the brakes they will not send the economy back into a tailspin ..However this still plays well into my scenario of a forthcoming bond crash as in doing so they will leave ample time for investors to front run them when time comes to take this liquidity away (My next post looks at the ICI  latest data release on  US Mutual funds flows, so watch out…)…all this seems very bullish equity and bearish dollar if you ask me….but you may have already read my previous posts …anyhow I though I would try to go quantitative on the Fed semantics and try to see if we have any notable changes in their wording by creating a word cloud for their July release versus this September. Basically the script looks at the frequency of each words in the release and scale  those words accordingly to the observed frequency. So the more repeated the word the bigger it is represented in the cloud. As you can see from the below it does not seem to be any material change…..same all same all….this monetary policy is not about to change…..

fomc july 2013fomc september 2013

July release                                                   September release

There is No Going Back !

My favourite data is out and guess what ? US investors are still selling bonds and buying foreign equities.

ici11092013  cumflow11092013

So I guess by now you must know  my thoughts if you have read my previous  posts. We are clearly heading for a bond crash and higher US yields is not a supportive factor for the dollar when money is going abroad…Looks to me  like private investors are tapering ahead of the Fed….