Monthly Archives: September 2013

US Mutual Funds Flow Data…They Are Still At It !

Ok it is ICI data release time again…and guess what ? US investors are still buying shedload of  global equities and dumping bonds. And the latter goes on despite the latest Fed statement being more dovish than expected and the retracement in Yields.

flow26092013 flowmap260920123

I ‘ll remain stubbornly long equity then…..and still look forward to a weaker dollar as those flows are currency un-hedged.

Thank you Chairman Bernanke for Bringing Christmas Early!

Yes it is Wednesday and you know what the ICI released my favourite data , so here it is in my pretty charts…..and guess what it is still about buying equities and selling bonds…the herd of private investors is on the move and there is not turning back… no surprise that global equity markets have held so well despite the worries about Syria, the FOMC statement and the German elections…..

ici flow 18092013 macromap 18092013

It looks to me that now that we have two event risks out of the way,  the German election will be another storm in a tea cup stirred by attention grabbing analysts paid by the headline…..Let’s be clear, the Fed has brought Christmas forward in their communique of this evening…how dovish do you need to be to support this year end rally ? As can be seen from my last chart there are still a significant amount of bonds to sell for equities…. so its not too late to participate in this move…. Could even make sense to  build an EM position if you ask me….

ici cum flow 18092013

What is the Fed Telling Us ?

Well yes it is FOMC time again and its seems to me that it is all dovish again and that definitively the Fed will stay behind the curve as long as is needed to have 100% certainty that when they hit the brakes they will not send the economy back into a tailspin ..However this still plays well into my scenario of a forthcoming bond crash as in doing so they will leave ample time for investors to front run them when time comes to take this liquidity away (My next post looks at the ICI  latest data release on  US Mutual funds flows, so watch out…)…all this seems very bullish equity and bearish dollar if you ask me….but you may have already read my previous posts …anyhow I though I would try to go quantitative on the Fed semantics and try to see if we have any notable changes in their wording by creating a word cloud for their July release versus this September. Basically the script looks at the frequency of each words in the release and scale  those words accordingly to the observed frequency. So the more repeated the word the bigger it is represented in the cloud. As you can see from the below it does not seem to be any material change…..same all same all….this monetary policy is not about to change…..

fomc july 2013fomc september 2013

July release                                                   September release

There is No Going Back !

My favourite data is out and guess what ? US investors are still selling bonds and buying foreign equities.

ici11092013  cumflow11092013

So I guess by now you must know  my thoughts if you have read my previous  posts. We are clearly heading for a bond crash and higher US yields is not a supportive factor for the dollar when money is going abroad…Looks to me  like private investors are tapering ahead of the Fed….

Time to Think FX…

It seems that the risks flagged for September are  slowly vanishing and that the risk agenda is now relatively clear for the remainder of the year. Syria is still a concern but there is now a possible alternative to a direct military intervention which is somehow good news. The German elections are nearing and though some uncertainty remains as highlighted by recent surveys, Merkel remains the likely winner. Of course there is the Fed meeting on the 17th &  18th  and the market eagerly speculating on the semantics of the Fed communique. Tapering or business as usual ? My thought is that all this is overblown and that we have been given a clear path of what will be the Fed monetary policy in the forthcoming cycle…so no real tradable surprise…Anyhow the equity market is taking this pretty well so far as reflected by last month performance and the low level of risk implied by the VIX. So business as usual…long those equity betas and short bonds….macromap11092013 VIX 11092013

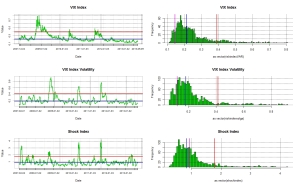
FX market have been correlating fairly well with the equity market and we have seen commodity currencies recovering significantly over the last few sessions . Also the Yen carry trade  still in favour with USDJPY breaking the 100 level. That being said most of the currencies have remained within statistically normal boundaries as indicated by the below charts which show the current  T-Stats for major dollar crosses and also their rolling 3-month T-Stats relative to a 95% confidence interval.

stretchmap 11092013  TOLLING TSTAT 11092013

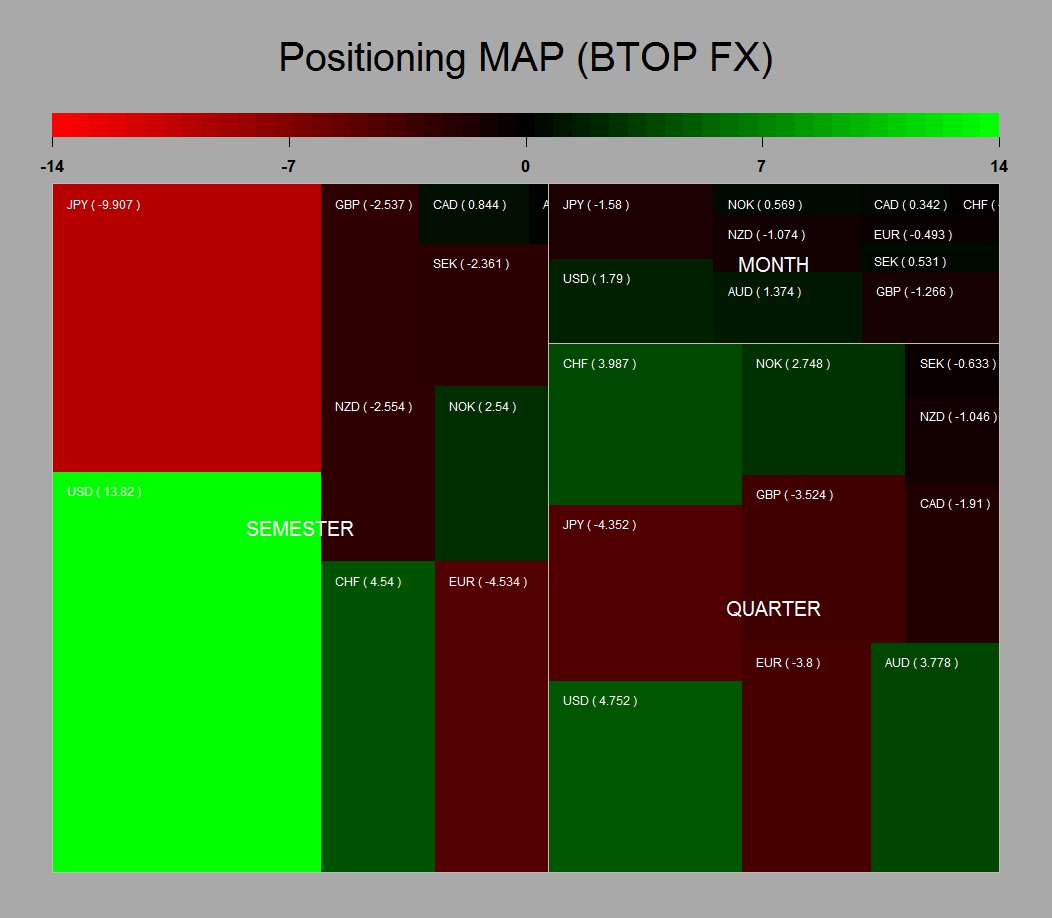
The below charts shows the sensitivity of the BTOP FX to major dollar exchange rates and therefore and idea of the portfolio content of most FX managers. The USDJPY  seems to be the trade favoured by the speculative community as well as dollar long generally speaking. Maybe more interesting is the second chart that shows an estimate of the leverage used by the FX managers peer group. It is derived by comparing the variance of the BTOPFX index and the Variance of  the estimated sensitivities for an unleveraged portfolio.

positioning map fx 11092013estimatyed gtearing 11092013

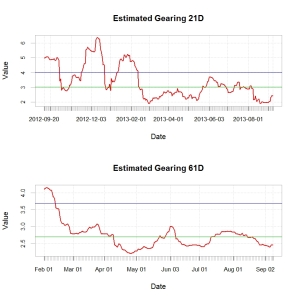
Overall the level of positioning  seems to be pretty average by historical standard. This lead me to think that there are still some good opportunities left in FX going to the end of the year. Assuming that no event comes to spoil the party I would hope to see a continuation of the recent trends…namely a sell off of the dollar as US investors   focus on international opportunities and more upside in yen crosses as they re-leverage…that being said I probably would remain cautious on outright long USDJPY due to the current positioning  and equity flows potentially weighting on the Greenback…

Unrelentless Love for International Equities…..

inflowoutflow06092013Ok the ICI has just released their latest dataset for August and there is no abating for International equities buying by US investors and conversely selling of bonds….

This may explains why the 10 years is currently trading close to a 3% handle…It looks like those payroll data may bring some further volatility to this.cumulative Flows 06092013

As mentioned in my previous posts, I think we are still at  the beginning of the spiral and that we have not as of yet seen much change in the velocity of the asset allocation shift taking place, so I believe all fundamentals being equal there are some good opportunities that remain in my scenario… I am still adding on my equity portfolio and ponder about the future effect of an unavoidable bond market crash…and yes I still think the dollar will weaken as those flows amplify and the appetite for international equities accelerate….