Category Archives: Bonds

It Is Still Buy Equities and Sell Bonds….

Ok the latest ICI data release is out again , so here are my favourite charts. An yet again no surprise it is buy international and domestic equities and sell bonds.

inflowoutflow

Now it has been 12 months that US investors are buying equities and 6 months that they are selling bonds (and my contention is that we have the same phenomenon in the UK) . What do you need more as a signal ?  The great rotation is just starting, so there is still time to come on board….

flowmap04122013

What really fascinate me is the amount of investment in bonds remaining to be culled by the private investors…even if you think within a balanced portfolio framework we should have a 60% bonds /40 % equity as a point of reference for a neutral the asset allocation… the chart below tells me that we are quite far from this level…..so buy equities… as long it is not PIMCO because their revenues are likely to be dented significantly unless they can re-invent themselves as a global equity manager…..

cumulflow04122013

Should I Stay or Should I Go ?

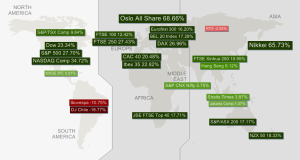
As we are nearing the end of the year and that typically we should see liquidity drying up as well as  rumors about a nasty retracement in equities abounding I thought I would have a quick look at some of my pointers. Clearly it has been a nice run so far and central banks have been very helpful in supporting the current bull market. The latest data from the ICI   demonstrates that there is no stopping American investors buying international equities and selling bonds. And my thought is that the situation is similar in many of the major economies which are on their way to recovery. I guess the risk of a major retracement in the bond markets in the next couple of years is still a significant risk  whilst upside likelihood remains limited so there is a strong rationale for a private investors to go bull on equities as the economy is picking up.  The chart below shows the significance of the inflow and outflow in US Mutual funds by asset classes and over various time horizons. The greener the more inflows the redder the more outflows….Clearly we have been in equity buying mode for a while now.

US MUTUAL FUNDS flowsDespite the significance of the flows observed the dent made to the level of investments  accumulated in bonds over the years  remains modest so far. This is good news for the current rally as therefore there  is still much adjustment to take place all being equal. Clearly  what we will experience ahead will be dependent on future economic growth. Bearing in mind the track record of accuracy of forecasts made by economists and alike my view of a significant economic growth in  the next few years based on the lagged response to the significant stimulus provided by major economies is as good as any. Over a shorter horizon  I think it is fair to say that so far governments and financial authorities have done a relatively good job and that the green shoots of recovery are well established. My view is that  central banks will be weary of adjusting their monetary policy  too fast as they will want to maximise the likelihood of  strong economic recovery and job creation. Inflation will definitively become acceptable if accompanied by strong growth. A scenario of higher nominal rates but not necessarily higher real rates should further promote  flows toward equities. Lets face it what we are seeing is structural and we probably have another few years of equity beta coming our way.

cumulative flows us mutual funds

I acknowledge that we  have had a significant upside in equity valuations this year if one takes exception of emerging markets.  Most markets have had  double digit returns  that can t remain unnoticed to the average investor . So despite my bullish view emulated in the above this  raises some issues about the market being possibly overbought.

untitled

The chart below investigates the periods were the S&P500 has had a statistically similar run and plots what has happened in the following 250 days ( I use a sample of daily data spanning from 1980 to date).   Clearly what we have seen  is pretty much average in regard of past bull markets  and from there the possibilities are broad we could retrace by close to 30% or rally by another 50%, if history is a guide at all.

S&P500

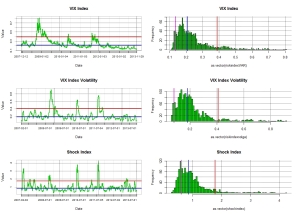
Meanwhile the VIX  which should embed market expectations  about possible risks remains well below its long term median. My other metrics of market risk Volga and Shockindex are similarly close to their historical low. This may indicate a level of vunerability of the market but also reflects that the flows going into equities are somehow dampening the market volatility.

risk metrics 
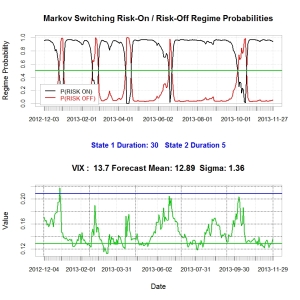
Finally my two-state Markov regime switching model still indicates  that we are within a risk on environement (i.e long equity risk) and there are no sign of  a change there.

markov

So  I guess I ll stick to my bullish view and will keep my broker unhappy by holding my positions…. no commissions for him in December….


Go Long Equities

As a follow up of all my posts on shift allocation, I thought the below link was of interest even though centric to the UK…

http://www.citywire.co.uk/money/welcome-to-the-stocks-and-shares-isa-club/a718079?ref=citywire-money-latest-news-list

What we are going through is structural ! Even if Yellen and the ECB are dovish ultimately rates will have to go up as the economy carry on to pick up. This will make bonds a disastrous investment relative to equities…..

Are We Going For A Year End Rally ?

Well for sure you must know my view on that. Now that the ECB as delivered some stimulus by making a surprise cut  and that the market is looking forward to further stimulus from the Fed. With Yellen speech coming up  and the fact that there does not seem to be much event risk left out there all m y risk metrics gives a green light for the risk on

risk metrics risk regime

Also the data released today by the Investment Company Institute is quite clear. there are no abating the appetite of mutual fund for Equity investors. However the dislike for bonds is evident and my view is that if Yellen comes on the dovish side this should not be a surprise to the market and probably will give opportunities for bond holders to sell their holdings at a better levels potentially.

flow map cumulative flows

However it is clear from the above charts that we are now dealing  with an establish trend of selling bonds for equities and that there is still a massive amount of bonds to get rid of by investors….better not to say yes too quickly for this job at PIMCO and to hang on those equity portfolios then……

Told You So…..

Ok I have been talking about an asset allocation  shift away from bonds and into equities for a while now as you can note from my previous posts…Clearly as you will see from my next post where I will update my analysis on US mutual funds inflows there is still a massive inventory remaining to clear and there is more of this to come still…..Now this is no joke for bond managers  as highlighted by this link from Bloomberg ( http://www.bloomberg.com/news/2013-11-04/gross-loses-world-s-largest-mutual-fund-title-to-vanguard.html )….Bill Gross has no longer the biggest bond funds…. maybe there is a good trade to make in equities… buy asset managers who have a focus on equities and sell  short the one who are predominantly bond managers….must be worth something across the next few years surely…..

Buy Global Equities…Sell Bonds !!!

My favourite data is out again and since  it has been a long time that I have not published my fancy charts and that we are at the 11th hour of debating the debt ceiling in the US this could be quite topical. Agree or disagree about what the typical US investors does and its predictive value I think they are right so far. Clearly the pattern of selling bonds is an on-going theme and favouring foreign equities against domestic one is now an established trend for US investors as can be seen from the charts below. The one on the right shows how significant has been the inflow/outflow in each of the asset classes across different time periods whereas the one on the left shows the inflow / out flow in US mutual funds so far this month.

ici flowsflow map 102013

So  what now ? I guess if we get some kind of  resolution it will  be good short term for those treasuries as it will support the US credit rating (what does Fitch know about it anyway ?….) . Clearly it should be good for risk appetite so I still think long  international equities is a good bet and get ready to sell some dollar after the next couple of days of exuberance …else I guess it is the idiocy that Buffet refers to…god save us all….nowhere to hide this time….

US Mutual Funds Flow Data…They Are Still At It !

Ok it is ICI data release time again…and guess what ? US investors are still buying shedload of  global equities and dumping bonds. And the latter goes on despite the latest Fed statement being more dovish than expected and the retracement in Yields.

flow26092013 flowmap260920123

I ‘ll remain stubbornly long equity then…..and still look forward to a weaker dollar as those flows are currency un-hedged.

Thank you Chairman Bernanke for Bringing Christmas Early!

Yes it is Wednesday and you know what the ICI released my favourite data , so here it is in my pretty charts…..and guess what it is still about buying equities and selling bonds…the herd of private investors is on the move and there is not turning back… no surprise that global equity markets have held so well despite the worries about Syria, the FOMC statement and the German elections…..

ici flow 18092013 macromap 18092013

It looks to me that now that we have two event risks out of the way,  the German election will be another storm in a tea cup stirred by attention grabbing analysts paid by the headline…..Let’s be clear, the Fed has brought Christmas forward in their communique of this evening…how dovish do you need to be to support this year end rally ? As can be seen from my last chart there are still a significant amount of bonds to sell for equities…. so its not too late to participate in this move…. Could even make sense to  build an EM position if you ask me….

ici cum flow 18092013

What is the Fed Telling Us ?

Well yes it is FOMC time again and its seems to me that it is all dovish again and that definitively the Fed will stay behind the curve as long as is needed to have 100% certainty that when they hit the brakes they will not send the economy back into a tailspin ..However this still plays well into my scenario of a forthcoming bond crash as in doing so they will leave ample time for investors to front run them when time comes to take this liquidity away (My next post looks at the ICI  latest data release on  US Mutual funds flows, so watch out…)…all this seems very bullish equity and bearish dollar if you ask me….but you may have already read my previous posts …anyhow I though I would try to go quantitative on the Fed semantics and try to see if we have any notable changes in their wording by creating a word cloud for their July release versus this September. Basically the script looks at the frequency of each words in the release and scale  those words accordingly to the observed frequency. So the more repeated the word the bigger it is represented in the cloud. As you can see from the below it does not seem to be any material change…..same all same all….this monetary policy is not about to change…..

fomc july 2013fomc september 2013

July release                                                   September release

There is No Going Back !

My favourite data is out and guess what ? US investors are still selling bonds and buying foreign equities.

ici11092013  cumflow11092013

So I guess by now you must know  my thoughts if you have read my previous  posts. We are clearly heading for a bond crash and higher US yields is not a supportive factor for the dollar when money is going abroad…Looks to me  like private investors are tapering ahead of the Fed….