Category Archives: Asset allocation

Quick Update on US Mutual Funds Flows…

Ok I have to admit last month was not as rosy as the previous 9 months if you invested in equity markets, but clearly this is not a disaster unless your time horizon is that short.

macromap1month macromap9mth

The good thing is that despite the  short term underperformance of stocks the appetite for global equities and the hatred for bonds is relentless as seems to indicate the latest release of the ICI data.

inflowoutflowbarchart28082013

Bearing in mind the overall size of the US Mutual Funds market and  the outstanding disproportionate bond holdings this should be comforting to the equity bulls. Even more comforting is that all  my equity risk metrics and my regime switching model give a green flag for holding equities.

vixrisk28082013 markov28082013

Of course there is Syria, the forthcoming discussion (or speculations) of tapering at the September Fed meeting as well as the German election to potentially exacerbate financial markets risk premium. However September is generally a month where liquidity comes back and this tends to dilute market risk….my bet is for a good old fashioned year end rally…sit tight !

Bond Managers , Tin Hat on Please !

Ok the latest ICI data on US mutual fund has just been released and guess what ? moms and pops  are still selling bonds like it is going out of fashion and buying equities like there is no tomorrow. Hence the red squares on my chart that shows the T-Stats of the inflow/outflow for each asset buckets over diverse time horizons.us mutual funds 14082013 …and yes those  10 year bond yields are still going higher and further incentivising the laggards to come out of their bond holding….
chart

To the risk of repeating myself  we all know that there is  a massive overhang in bond holdings, so my contention is that we may have entered a spiral and that somewhere on the line we are going to see a repeat of 94…..a good old fashioned bond market crash….

cumulative inflow 14082013

Meanwhile as we gathered from the Fed minutes everyone is getting very cagey about mentioning  when they will start tapering  (or is it tampering…) ….looks like the street is about to dictate the Fed monetary policy by jettisoning  those low yielding assets for something more sexy…..

Quick Update on US Mutual Fund Flows….

It looks  like American investors are still switching away from bonds in July as per the recent data of the ICI. I  have put together  a few of my usual charts to visualise this. The appetite for bonds is a mirror of what it is for equities.

mutual funds map 26072013 inflowoutflow26072013

As mentioned in my previous post on the same subject my feeling is that we could see all this impact the strength of the US$ . Many economists out there are entrenched in their scenario of rising yields and GDP for the USD over the medium term with a strengthening of the US$.  Whereas I agree on the rising yields and GDP in the US, I somehow strongly disagree on the effect on the US$. Clearly the world has had a domestic bias since 2008 and this has been reflected on the risk adversity of the average US investor  asset allocation which was primarily dominated by bonds and somehow local equities. If investors become a bit more adventurous , they will start to invest more significantly in international equities (as shown in the above charts) therefore they will need to sell some US$ in the process. In that scenario it may well be that the EURUSD does not present such a bad value at 1.3280……

I Smell Bear Steak….Again !

Looks like there is no abating to for equity appetite out there. And there some are good reasons to be hungry for it…bonds won’t g bring you any decent yield whilst still bearing a massive Fed tapering tail risk. Despite the Fed floating some  reinsuring words about the measured pace at which they will withdraw the liquidity it supplied, make no mistake they will. Now the big question is: Will the market front run them and dictate the monetary policy going ahead ? Clearly if  the bond market inventory is to adjust drastically as your typical US and foreign household start to take more risks in equity markets and redeem their bond funds in the process this must also mean something for the short end of the yield curve……In that respect I am still pondering about the possible  effects of this as clearly the outstanding bond holding in US mutual funds is very large indeed not to use the word humongous.  Maybe we are not too far to discover what is the answer to this question as there seem to be clearly a general dislike for bonds and a growing appetite for equities out there. The ICI on inflow/outflow in US mutual funds illustrates well  what is taking place. The chart below shows what has been the inflow / outflow for the first half of  July, significant inflow in domestic and foreign equities and outflows in bond products….Pretty much a continuation of what happened in June, aside the inflows in domestic equities which were negative last month.

outflowinflow 18072013

Meanwhile if we look at the risk environment, the VIX trades pretty much on its long term median and a 2-state Markov regime switching model tells us that we are fairly well entrenched in a “Risk on” scenario.

regime18072013

Bearing in mind a background of  fundamentals that do not seem to be on the awful side if we are to believe Moody who changed its outlook  from negative to stable for the US, I can’t help to be still in love with equities….Bond managers, tin hat on please !

Is This What We Have Waited For ?

The answer seems to be yes  as far as what took place in June. This is the start of a  proper bond bear market, thank you Mr Bernanke. When one looks at the June data on outflow / inflow in US mutual funds just released by the ICI it becomes obvious that we are not dealing anymore with ordinary moves. The outflow in taxable bond funds was similar in term of intensity to what we observed in equity funds in October 2008. There is a smell of panic amongst bond investors and with good reason, the remaining inventory is massive and the gate is narrow. The guys at PIMCO would know about it  as they had an estimated US$ 10bn outflows last month. What is quite exciting about all this is that we have seen some inflow in international equities over the same period. This clearly looks like the onset of the shift in asset allocation  I have been so fond of over the last year and half (see my previous posts). Anyhow I thought I would display my usual charts….please look away if you are still overweight bonds…

ici 03072013flowmap 072013

The above charts shows the monthly inflow outflow in US mutual funds. The chart on the left plot the data relative to its long term median and 95% up/ interval of confidences. The data for bond is way out of scale. The chart on the left shows the T-stats of the inflow/outflow (i.e. how significant they have been) over various time period. Despite the recent inventory adjustments  bond holdings still remain very rich which would indicate that there is  further room for a significant sell off in fixed income unless the Fed shy away  from its view on tapering, better watch this job data then…..

flow and risk bond outflows june 2013

The charts above shows the outflow/inflow relative to the VIX. We have not seen much increase volatility in the equity markets, the VIX  averaged 17% in June.  We just had a minor outflows in US equities but also interestingly a notable inflow in both hybrids and international equities….This looks like the onset of an asset allocation shift to me. Finally it may be worth to start mulling over what would be the effect of further significant investing in foreign assets by US investors on the strength of the US$…..

US Mutual Funds Flow Survey

Ok yesterday’s call on the VIX was great , no need to say thank you. Anyhow I thought it would be timely to look at the Investment Company Institute data and that it would be interesting to visualise the data and to look at the effect of risk on investors preferences for the assets classes in time of market stress. The following show the inflows/outflows in bonds, equity and hybrid US mutual funds. Quite clearly Mr Bernanke speech dented the appetite for bond products but despite appetite for equity product abating it did not really substantiate significant outflows there. The charts below show the monthly inflows / outflows relative to their median and a 95% interval of confidences. The charts on the right just give a distributional representation of the monthly data.

inflowoutflow

The chart below shows the T-Stat (i.e. the level of significance) of the inflows across 4 different time periods. The outflows in bonds switched to negative over the last 3 months but equities and particularly holdings in international have hedl well.

flowmap

In the below I used a bit of code wizardry to look at what happen when market risk increases. I use the VIX as my risk metric.  When markets went “postal” in October 2008 it was quite clear then US equities suffered the most  outflows but the bond market remained quite resilient as the fed came to the rescue.

flowrisk102008 2008 outflows

Clearly the financial volatility has not reached levels experienced in the last quarter of 2008 and there is clearly no dislocation of the financial system this time.  So no reason to panic. The chart below shows  the Bonds were the main recipient of the market aversion but all this is very tame by any means.

062013 outflowsrisk062013 outflows

My thought is that as the market normalise and comes to terms with the Fed policy we will see further sell off in the bond markets and that the proceeds will be reinvested in the equity markets as the shift in the Fed monetary policy will be driven by better economic fundamentals….no need to go into cash this time….

An unbalanced world of capital allocation….

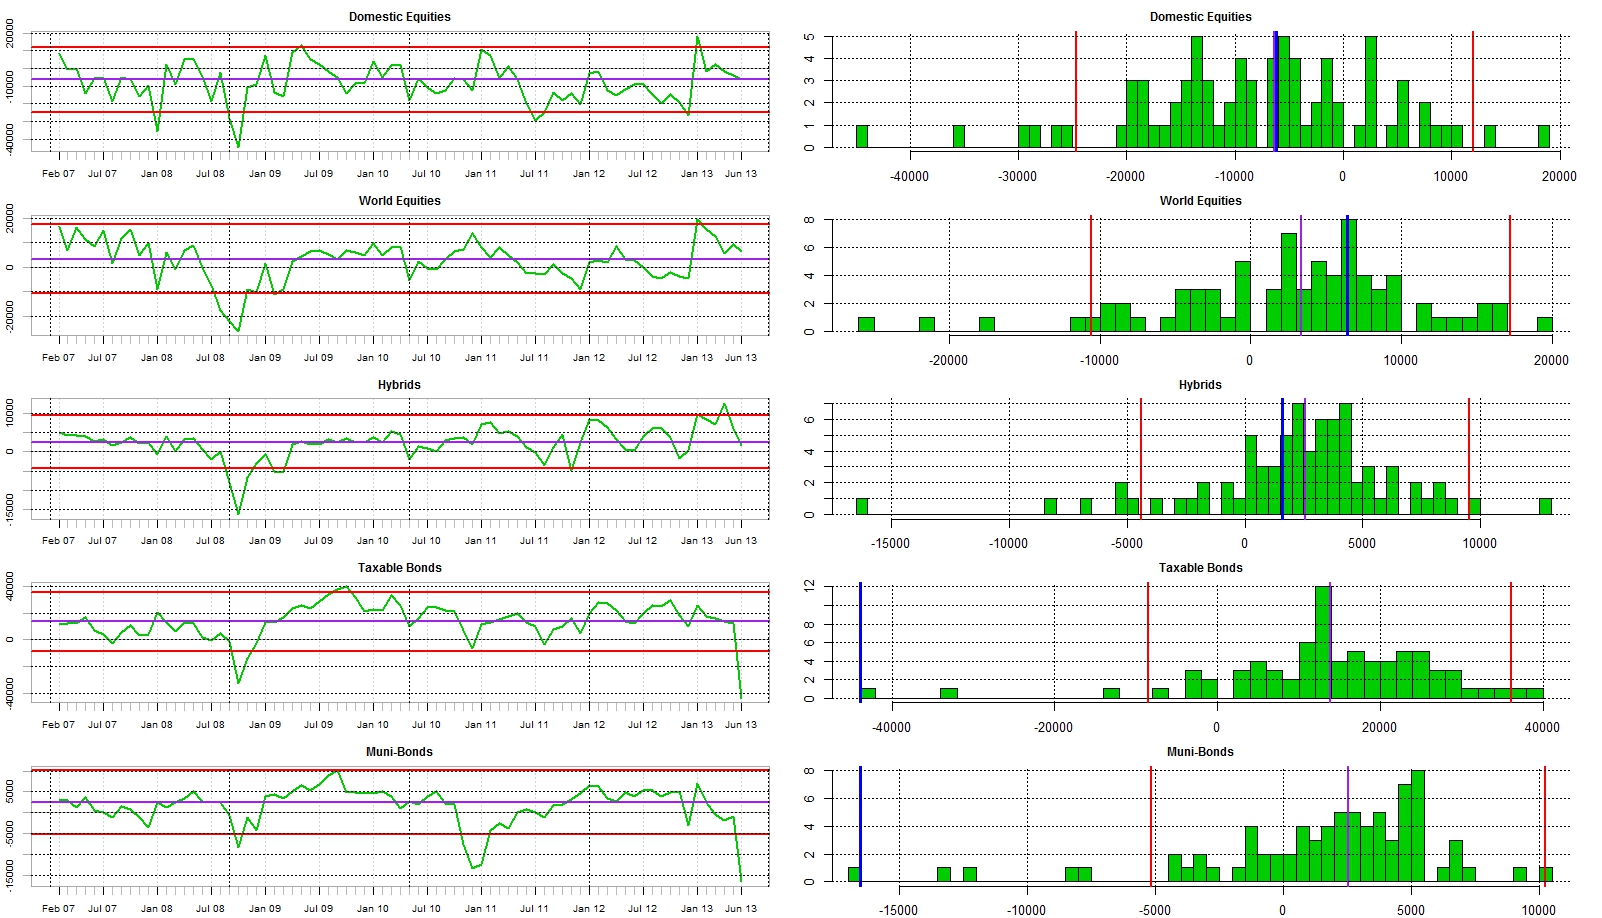
I have been extremely fond of a bullish equity market scenario since early 2012. This play has  now worked well  despite talks of dislocation in Europe , Korea bellicosity, possible slowdown in China and other potential risk events.  One of the triggers behind my view was an early  realisation that the extremely loose monetary policy conducted by central banks would feed into an unsustainable bubble in the bond market  and that this would activate a logical shift in both the private a public asset allocation preference.

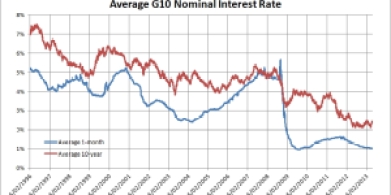
Clearly, so far, central banks  have been successful in bringing  nominal and  real rates to unprecedented levels and by the by  have incentivised market agents to seek assets with higher returns and also higher intrinsic risks. Furthermore any upside in inflation will bring real rates even further in negative territory and bring another incentive for private and institutional investors to channel their capital resources toward riskier assets. This may prove a useful re-allocation of capital though it will create issues for central bank when the brunt of the shift take place as bond valuation may undesirably tumble. Meanwhile  I would argue that despite the significant move we observed in equities over the last year , we have not yet seen the full delivered effect of this ultra-loose policy stance.

world-stock-market-performance

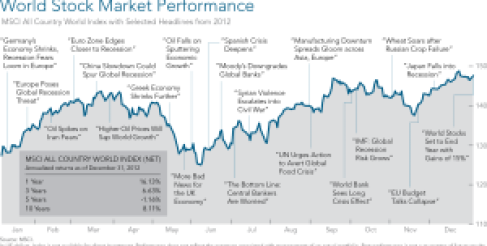
World stock markets 2012

Untitled

S&P 500 2008 to date

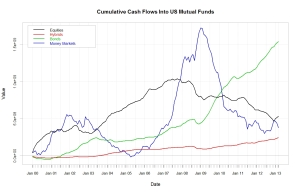
Investors response has been  muted and we have not as of yet seen a significant asset allocation shift toward equities. This is well demonstrated by the data on US Mutual funds in flows compiled by the Investment Company Institute in the US.   During the first quarter of this year we have started to see the premise of a what could become a significant move as private and institutional investors have become less sticky to their cash holdings and allocated some of their capital toward equities. However bond holdings remain at a level that statistically is highly non-normal.

ICI - Release Estimated Long-Term Mutual Fund Flows, May 8, 2013 significance of inflow in us mutual funds

Bearing in mind the low yield of the asset class, bettering growth in the US and public debate about the Fed exit policy, it becomes more and more difficult to ignore the  bond bubble engineered by central banks. Also the attraction of greater excess returns that have been side-lined by most investors because of black swan and a “al la Roubini” doomsday scenarios becomes more tempting…. What may explain part of the move in stock markets so far is that companies are now more efficient due to their cutting costs ahead of expected difficult times. Therefore their stocks have been re-priced to reflect their stronger balance sheet and reduced borrowings. The price adjustment has not been led by  a change in the investor inventory so far but by a new perception of their true fundamentals. The massive capital destruction that took place in 2008 conditioned investors, analysts and media to adopt a risk averse stance. Their financially induced behaviour  remains proportionally sticky to the amount of pain endured and to some degree has been self feeding as reflected in past numbers of consumer confidence. Consequently the appetite for risk remains low for a long time due to the intensity of the capital erosion we experienced.  The 2008 financial crisis created a self feeding mechanism where pessimism  and  formulation/expectations  of doomsday scenario would become the rewarded norm. Economists became suspiciously short term in their views due to economic data becoming more volatile  and therefore more difficult to forecast. Analysts and journalists got better rewarded for being a “Roubini” rather than isolated optimists. This change in behaviour has not delivered value to the end investor. Scaremongering drove investors to become sticky to their riskless assets and to ignore substantial excess returns that capital markets had in offer for them. Potential liabilities and fiscality risks drive  institutional and private investors to reconsider their allocation of capital. In the one hand it would be reckless for pension funds not to reduce their bond exposures when the Fed start to debate their exit policy.  Rising interest rate as central banks will withdaw liquidity  potentially  create significant short/medium term liabilities on their bond portfolios potentially inducing significant portfolio re-balancement. On the other hand rising fiscality  by government seeking to replenish their coffers will  drives private investors to demand higher returns. They will achieve this by investing in riskier assets  and by going cross border to chase higher opportunities. My thought is that as  the preference shift for stocks will take place we will see companies put this capital to work to capture new market opportunities and further  invest into  R&D. Exactly what governments and central banks want since it should generate new jobs.  We are about to enter a long cycle where equities will dominate as the investors preferred asset class.  As more cross-border investments will occur we will see  stronger trend and higher volatility in currency markets which have been lacklustre over that last few years.  I would expect the US Dollar to remain weak as much private capital in the US will seek diversifying opportunities… I ll stay long equities and definitively away from bonds for a good decade…